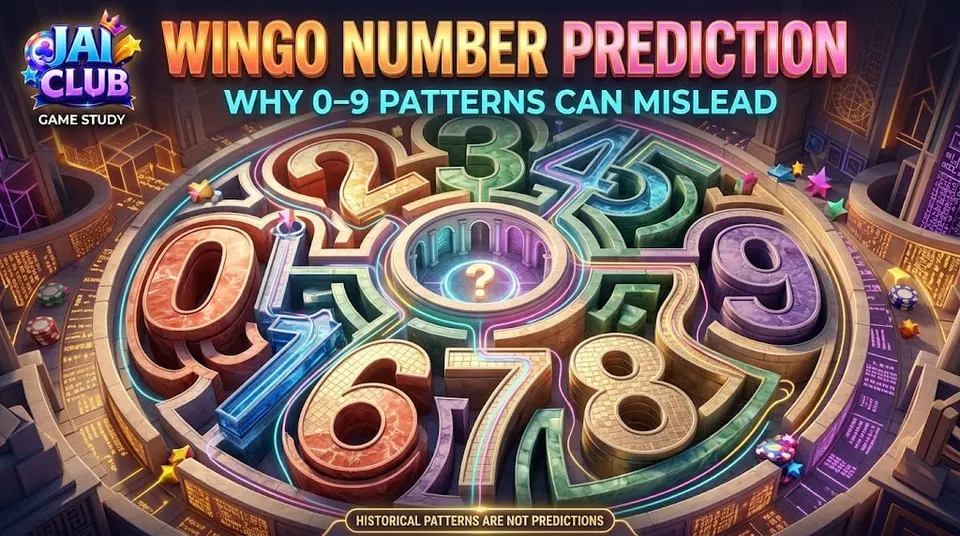
Wingo Number Prediction: Why 0–9 Patterns Can Be Misleading
Understand Wingo number prediction, digit frequencies, repeated numbers, missing-number charts, probability and why observed 0–9 patterns may not predict future rounds.
In this article
- Understanding the Wingo Number Range
- How Wingo Number Prediction Charts Work
- Understanding Digit Frequency
- Fictional Frequency Table
- Why Small Samples Can Be Misleading
- What Are Missing Numbers?
- Understanding the Gambler's Fallacy
- Hot Numbers vs Cold Numbers
- Consecutive Numbers and Repeated Digits
- Odd and Even Number Patterns
- Does Number Position in History Matter?
- Can a Formula Predict the Next Digit?
- Why Prediction Methods Often Disagree
- Number Prediction and Colour Prediction
- The Financial Risk of Pattern-Based Predictions
- How to Interpret Wingo Number Data Responsibly
- Frequently Asked Questions
- What is Wingo number prediction?
- What numbers are used in Wingo?
- Can a missing number be predicted?
- Are hot numbers more likely to repeat?
- Can a number appear several rounds in a row?
- Is a number frequency chart useful?
- Does the period number reveal the winning digit?
- Can AI accurately predict Wingo numbers?
- Does this guide provide today's winning number?
- Conclusion
Wingo number prediction often focuses on a small collection of digits, usually displayed from 0 to 9 in number-based gaming interfaces. Because the possible results appear simple, people sometimes assume that identifying the next number should also be straightforward. They may study recent outcomes, mark repeated digits or count how long a particular number has been absent.
These observations can create patterns that appear meaningful. A number might occur several times in a short history window, while another might remain absent for many rounds. Some prediction charts describe the frequently appearing digits as hot numbers and the less frequent digits as cold or missing numbers.
However, identifying an observed pattern is not the same as demonstrating that the next result can be forecast. This guide explains how digit frequency, streaks and missing-number charts work, what probability tells us and why historical records alone may produce misleading expectations about future rounds.
Understanding the Wingo Number Range
Many Wingo-style games use the digits 0 to 9 as their primary result numbers. These digits may also be associated with categories such as Big, Small and colour classifications under the applicable rules.
The visible simplicity of the number range can make the game appear easy to analyse. There are only ten possible digit labels in this common format, and their frequencies can be calculated using ordinary arithmetic.
However, the number of possible labels does not establish the probability of each outcome. A uniform distribution would assign equal chances to the digits, but that is a mathematical assumption that must be checked against the actual system.
Different versions may also use different mappings, prize structures or result-generation rules.
For an introduction to the game interface, read the Jai Club Wingo Guide.
How Wingo Number Prediction Charts Work
A number prediction chart may organise previous results into columns or rows, showing which digit appeared during each completed round. Some charts include colour labels, round identifiers or counts indicating how frequently each number has occurred.
More elaborate displays may show streaks, gaps between appearances and percentage distributions. These measurements can be mathematically correct descriptions of the historical dataset.
The problem arises when a descriptive statistic is presented as a reliable prediction without appropriate evidence.
For example, a digit appearing four times in twenty rounds has a historical frequency of 20% within that sample. That figure does not automatically prove that the digit has a 20% probability of appearing in the next round.
Understanding Digit Frequency
Digit frequency measures how many times a particular number appears within a selected dataset. It is one of the simplest statistics used in Wingo prediction discussions.
Consider the following fictional history containing twenty outcomes:
2, 7, 1, 7, 4, 0, 9, 3, 7, 5, 2, 8, 1, 6, 7, 4, 0, 3, 9, 2
This sequence contains ten possible digit labels, with some appearing more often than others. Counting the appearances gives a summary of the recorded history.
Fictional Frequency Table
| Digit | Appearances | Historical share |
|---|---|---|
| 0 | 2 | 10% |
| 1 | 2 | 10% |
| 2 | 3 | 15% |
| 3 | 2 | 10% |
| 4 | 2 | 10% |
| 5 | 1 | 5% |
| 6 | 1 | 5% |
| 7 | 4 | 20% |
| 8 | 1 | 5% |
| 9 | 2 | 10% |
| Total | 20 | 100% |
The table describes a fictional dataset. It is not a Jai Club result history or a prediction for an upcoming round.
The number 7 appears most frequently, but that observation alone does not establish that 7 will appear next.
Why Small Samples Can Be Misleading
A small collection of results can show substantial variation even when all possible outcomes have equal underlying probabilities.
In a uniform ten-digit model, the expected frequency of each digit over twenty independent outcomes is two appearances. That does not mean each digit must appear exactly twice.
Some numbers may appear more frequently, while others appear once or not at all. Such variation is not necessarily evidence of a trend or defect.
As more data is collected, observed frequencies may become more stable under appropriate assumptions. However, increasing the sample size does not automatically turn a historical frequency chart into a reliable future prediction tool.
What Are Missing Numbers?
A missing-number chart often records how many rounds have passed since a particular digit last appeared. A number that has not appeared recently may be described as overdue.
For example, if a fictional digit last appeared twelve rounds ago, the chart may show a gap of twelve rounds. This is a correct description of elapsed history if the record is accurate.
However, the label overdue can be misleading because it implies that the game is required to produce the missing number soon.
In an independent random process, a long absence does not make a particular number more likely on the next round.
Understanding the Gambler's Fallacy
The gambler's fallacy occurs when someone believes that previous independent outcomes must be balanced by future outcomes.
A person might argue that because the number 5 has not appeared in many rounds, it is now more likely to appear. Another might assume that a repeatedly appearing digit must stop appearing.
Neither conclusion follows from the historical sequence alone when the relevant outcomes are independent.
Random sequences can contain both repetitions and long gaps. The existence of these patterns does not create a predictable correction mechanism.
Hot Numbers vs Cold Numbers
Hot and cold labels are commonly based on recent frequency. A hot digit appears relatively often in the selected sample, while a cold digit appears relatively rarely.
These definitions change when the sampling window changes. A number may be hot over ten rounds but average over one hundred rounds.
That makes the labels dependent on how the data is selected. A chart showing only a short window may emphasise a pattern that becomes much less striking when more history is included.
A number's recent frequency should not be confused with its actual probability of appearing during the next event.
Consecutive Numbers and Repeated Digits
Some readers focus on repeated digits because consecutive appearances can look unusual. A sequence such as 7, 7, 7 may lead to claims that 7 is either highly likely to continue or certain to disappear next.
Both interpretations require evidence about the underlying process.
In a fictional independent uniform ten-digit system, the probability of a specified digit appearing on one round is 10%. Previous appearances do not change that theoretical probability for the next independent round.
The fact that a sequence looks surprising does not establish that its next element can be predicted.
Odd and Even Number Patterns
Wingo number analysis sometimes divides digits into Odd and Even categories. In the standard mathematical classification, even digits from 0 to 9 are 0, 2, 4, 6 and 8, while odd digits are 1, 3, 5, 7 and 9.
These are mathematical categories, but whether an actual gaming platform uses them as selectable result types depends on the verified game rules.
Counting Odd and Even outcomes may help summarise previous numbers. However, a sequence containing several odd numbers does not, by itself, establish that an even number must appear next.
The same caution applies to Big and Small categories. Our Jai Club Wingo Big vs Small Guide explains how those labels are used.
Does Number Position in History Matter?
A chart may display results from newest to oldest or vice versa. Misreading the order can create incorrect assumptions about streaks, gaps and frequency changes.
Round identifiers are important for matching a result to its correct period. If rows are missing or duplicated, the apparent sequence may be inaccurate.
A prediction tool using incomplete data can therefore produce misleading statistics even before any forecasting claims are considered.
The first requirement for useful analysis is accurate, correctly ordered historical information.
Can a Formula Predict the Next Digit?
A formula can produce a numerical suggestion, but its existence does not demonstrate predictive accuracy.
For example, a program might calculate the average of recent results, select the least frequent digit or apply arithmetic to a round identifier. These operations can be performed consistently without revealing the outcome of another system.
To show predictive value, the formula would need to be tested on new data that was not used to design it.
A reliable evaluation would also compare the formula with a justified baseline and retain every unsuccessful forecast.
Why Prediction Methods Often Disagree
One method may favour frequently occurring numbers, while another prioritises digits that have not appeared for many rounds. A third may generate values randomly.
Because the methods use different assumptions, they can produce conflicting suggestions from the same history.
That disagreement does not mean that one tool has necessarily identified a secret pattern. It may simply reflect different calculations applied to historical observations.
Without independently verified testing, there is no basis for treating one formula as reliably superior.
Number Prediction and Colour Prediction
A number result may also be assigned to a colour category according to the game's mapping rules. This creates a relationship between digit outcomes and colour labels, but the relationship must be checked for the particular version.
Predicting an exact digit is different from forecasting a broader category. The probability structure may also differ depending on how numbers are grouped.
A chart designed around one operator's mapping should not automatically be applied to every Wingo-style interface.
A number-to-colour table is useful for classifying results, not for demonstrating that the next result is known in advance.
The Financial Risk of Pattern-Based Predictions
Historical patterns can appear persuasive, especially when accompanied by coloured charts, percentages or claims of expert analysis. However, their visual presentation does not remove uncertainty.
A person relying on a missing-number chart may continue making wagers in the belief that a particular digit must appear eventually. This can lead to cumulative financial losses.
Likewise, a successful prediction does not establish that the next one will also succeed. Chance matches can occur without a reliable forecasting method.
Money-related gaming should never be treated as a dependable income source on the basis of historical digit patterns.
How to Interpret Wingo Number Data Responsibly
An accurate result chart can provide useful information about completed rounds, including number frequency, category counts and the order of historical outcomes.
The strongest interpretation is descriptive. A chart tells readers what happened within the recorded dataset. Any claim that it also predicts future events requires separate evidence.
When an article presents a prediction percentage, readers should ask whether it describes past frequency, a model output or a probability supported by the actual game design.
These distinctions prevent descriptive statistics from being mistaken for guaranteed future results.
Frequently Asked Questions
What is Wingo number prediction?
It is the attempt to forecast a future number in a Wingo-style game using historical records, calculations or other methods.
What numbers are used in Wingo?
Many Wingo-style formats display digits from 0 to 9, although the actual rules depend on the platform.
Can a missing number be predicted?
A long absence does not, by itself, establish when a number will next appear.
Are hot numbers more likely to repeat?
Recent frequency alone does not prove that a number is more likely in a future independent result.
Can a number appear several rounds in a row?
Yes. Repeated outcomes are possible in many random processes.
Is a number frequency chart useful?
It can accurately summarise previous results if the underlying data is correct.
Does the period number reveal the winning digit?
A period identifier alone does not establish the result-generation method.
Can AI accurately predict Wingo numbers?
Any such claim requires credible evaluation on future unseen data.
Does this guide provide today's winning number?
No. It provides educational information about number patterns and probability.
Conclusion
Wingo number prediction often relies on patterns involving digits from 0 to 9, including repeated results, hot numbers, cold numbers and gaps between appearances. These observations can be measured and displayed accurately, but they do not automatically provide a way to forecast the next round.
Small samples can show surprising patterns, and different formulas can produce conflicting suggestions from the same history. Reliable predictive claims require evidence beyond visual charts and retrospective success stories.
The most useful approach is to interpret result history as a record of completed events rather than a guarantee of what must happen next.
For further background, read the Jai Club Wingo Guide.
Editorial disclaimer: All numerical examples are fictional. This article does not provide betting predictions or guaranteed game results.